Version Française: cliquez ici
|
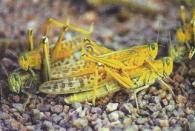
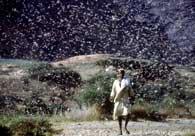
In September-October 2004, the Sahelian region, and most particularly Mauritania, Senegal, Mali and Niger, has suffered the worst locust invasion for almost 20 years. As an example, one of the locust swarms was reportedly over 70 kilometers in length.
Over 4 millions hectares of land have been infested by locusts in West Africa, as the annual harvest was under way. Crop damages caused to agriculture have been estimated to about 25% in West Africa, putting at risk the livelihood of 150 million people.
Given the importance of the locust invasion in 2004, agriculture experts have warned that it would take two or three years to reduce the number of insects to the point where they no longer present a significant threat to agriculture.
|
|
The monitored area extends over 4500 x 2400 kilometers. It englobes the major part of the Sahara desert, as well as the whole Sahelian region.
The maps produced by ParBleu Technologies Inc. are presented in homolosine Goode's cartographic projection, with the following spatial resolutions :
|
|---|
The maps below are destinated to be introduced within Geographic Information Systems dedicated, either to the monitoring of vegetation and crop growth in order to predict agricultural yields and production, or to the monitoring of environmental conditions in the framework of the battle against locusts.
The spatial resolution of the maps below is 5 x 5 kilometers.
These maps show the whole geographic area monitored using the spaceborne sensors MODIS in the framework of the present project.
Click on Senegal, Mauritania, Niger, or Burkina Faso to access the full spatial resolution (500 x 500 meters) maps covering these countries.
The map below represents the evolution of the percentage of vegetation cover, between January and April 2005.
From this map, it is possible to retrieve the average monthly values of the percentage of vegetation cover, thanks to the digital pixel values:
| Image channel | Corresponding period |
| 1st (red channel) | March 6th - April 6th, 2005 |
| 2nd (green channel) | February 2nd - March 5th, 2005 |
| 3rd (blue channel) | December 26, 2004 - January 26, 2005 |
The value of the percentage of vegetation cover can then be obtained as follows, through the simple relationship :
% (vegetation cover) = (digital pixel value - 40) / 2
The margin of error is estimated to +/- 10%.
The offset of 40 units has been introduced to enable the representation of the desert areas (without any vegetation).
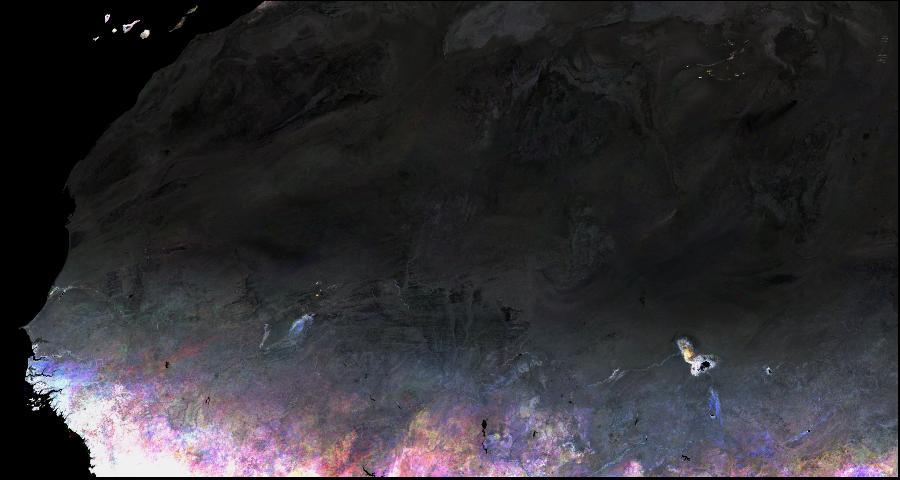
Areas exhibiting Blue tones are the areas where the vegetation cover has constantly decreased during the observation period.
Areas exhibiting other tones are the ones where some vegetation growth has been observed between January and April 2005.
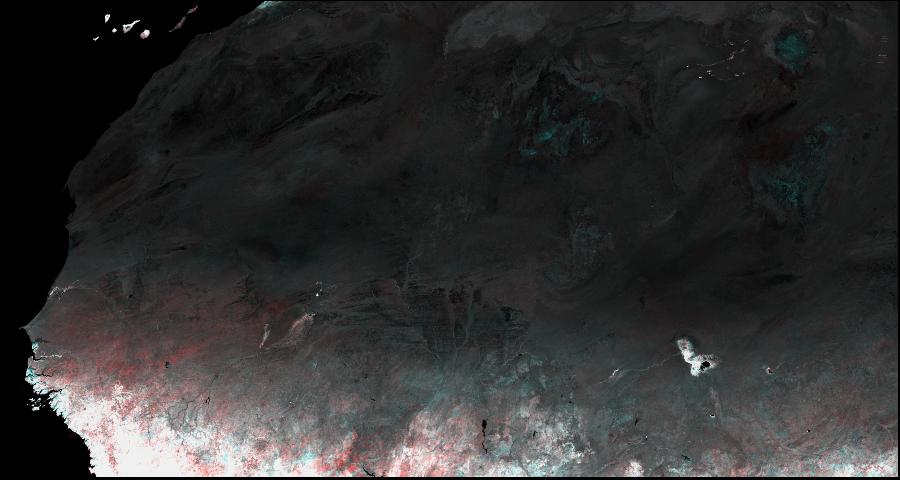
The map hereunder represents the evolution of hydric stress between January and April 2005.
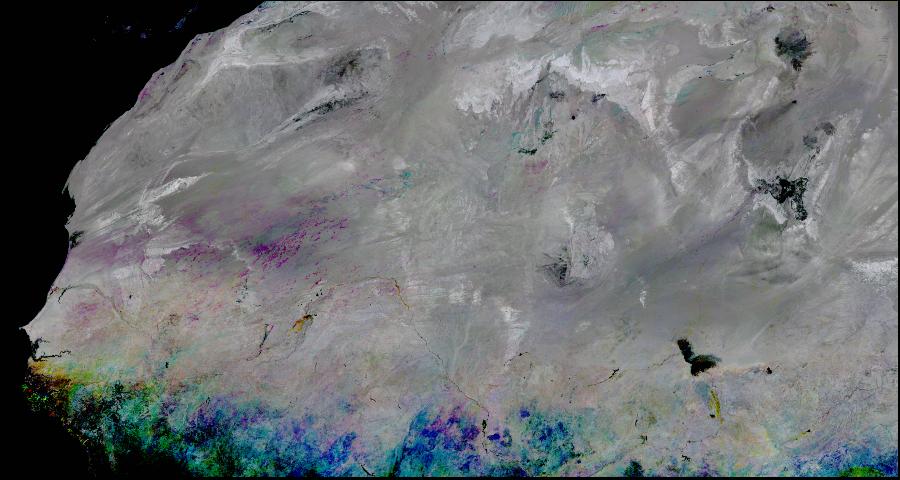
In the absence of calibration data, it has not been possible to establish a quantitative relationship between pixel values and the soil moisture content (Hydric stress increases with the pixel values).
Calibration measurements would allow to establish such a relationship enabling the quantitative estimation of soil moisture content.
From this map, it is possible to retrieve the average monthly values of our hydric stress index, thanks to the digital pixel values :
| Image channel | Corresponding period |
| 1st (red channel) | March 6th - April 6th, 2005 |
| 2nd (green channel) | February 2nd - March 5th, 2005 |
| 3rd (blue channel) | December 26, 2004 - January 26, 2005 |
The following image enables to compare the percentage of vegetation cover between the present year and a locust-free year.
Red tones denote the areas which are more vegetated in 2005, whereas blue tones denote the areas which are less vegetated in 2005.
The average monthly values of the percentage of vegetation cover can be retrieved from the digital pixel values, using the above mentioned relationship.
| Image channel | Corresponding period |
| 1st (red channel) | March 6th - April 6th, 2005 |
| 2nd and 3rd (green and blue) | March 6th - April 6th, 2003 |
Produced by PARBLEU TECHNOLOGIES Inc. under mandate of the Canadian Space Agency.
(Standing Offer for Disaster Management Information Products and Services; PWGSC File Number 9F028-014927/008/ST)
Procurement of the TERRA/AQUA MODIS imagery ('MODIS 32-day Global Composites products)
Courtesy of the University of Maryland, 'Global Land Cover Facility' (URL:
http://glcf.umiacs.umd.edu)
Operational partners of PARBLEU TECHNOLOGIES Inc. :
 |
 |
 |
| Privateers NV | Treemail | AP Formation |
Copyright (C) PARBLEU Technologies Inc., 2005